Grapho - Data Science + Storytelling

Our world is complex and interconnected which is why graph databases, which focus on the relationships between data, have become a must-have tool for studios like Mod. Having harnessed the power of the new ISO Graph Query Language standard for our own work, we can now share our "data science + storytelling" approach more broadly.
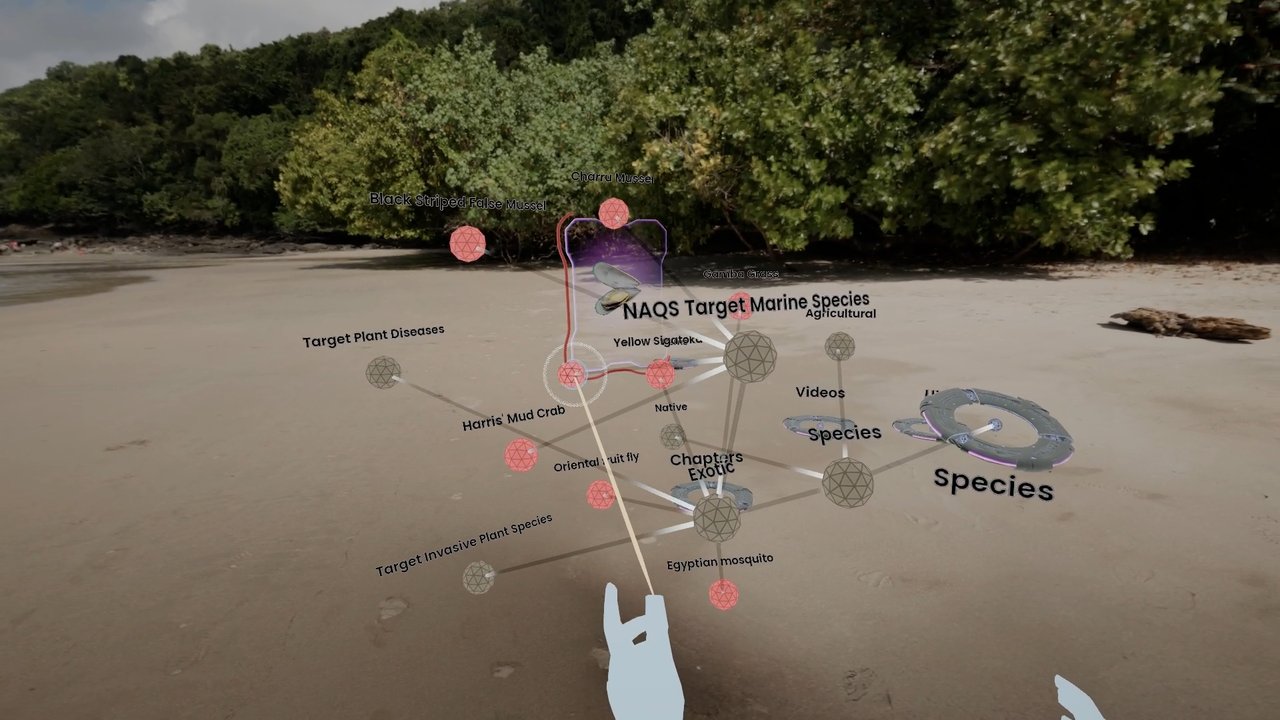
Our Grapho toolkit provides innovative and elegant ways to get a handle on your data, including Grapho XR - our spatial graph browser.
Grapho XR Demo is available now on the Meta Store as a free download.
Get in touch to discuss you can use data science and graph data storytelling to unlock new insights and explore your data. We offer licensing, platform-as-a-service and consulting options for any scale of project.
Developers can download our free grapho-server on github to get started today.
- Standard interaction mechanics across different datasets and applications
- Easy-to-use web and game engine tools
- Desktop, mobile and cloud hosting options
- Developer-friendly integrations with Neo4j, python, Unreal Engine, Houdini and much more
Check out the Grapho User Guide and Developer Guide docs.grapho.app
Look at screenshots on Flickr
Read our SIGGRAPH2022 paper: A Clever Label: Multi-sensory VR data visualization for art, productivity and communication